NOAA Data Tampering Update
October 14, 2018
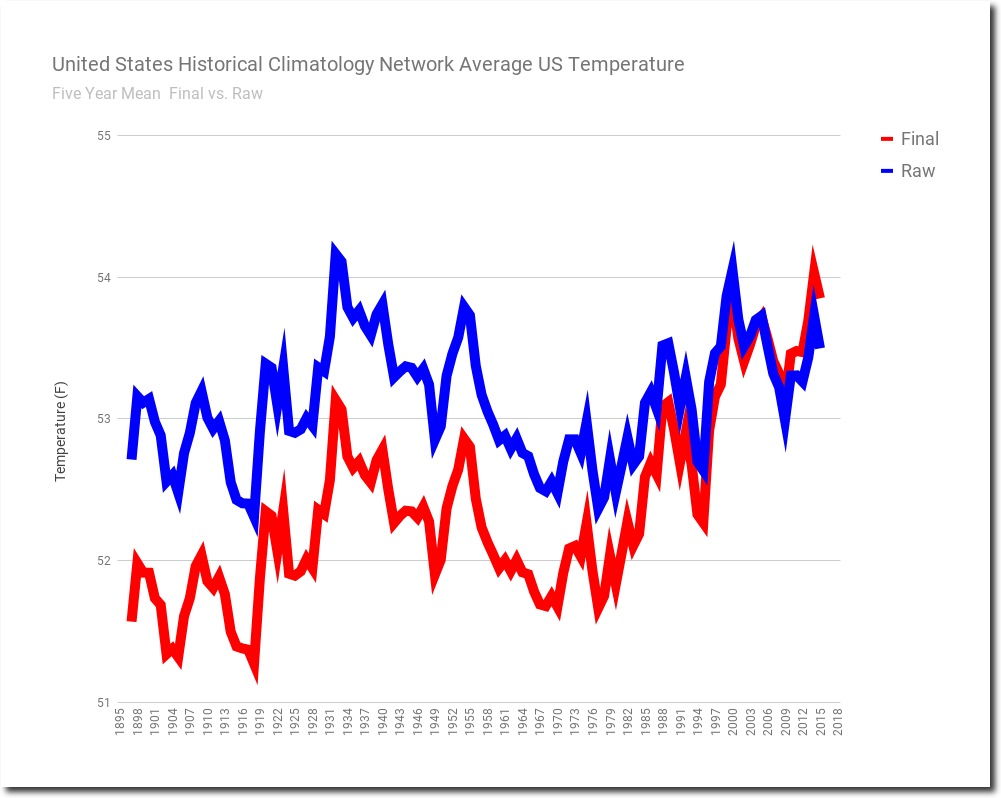
Latest data from the United States Historical Climatology Network, showing how the US warming trend is created by altering the data in a spectacular hockey stick.

Spreadsheet Data
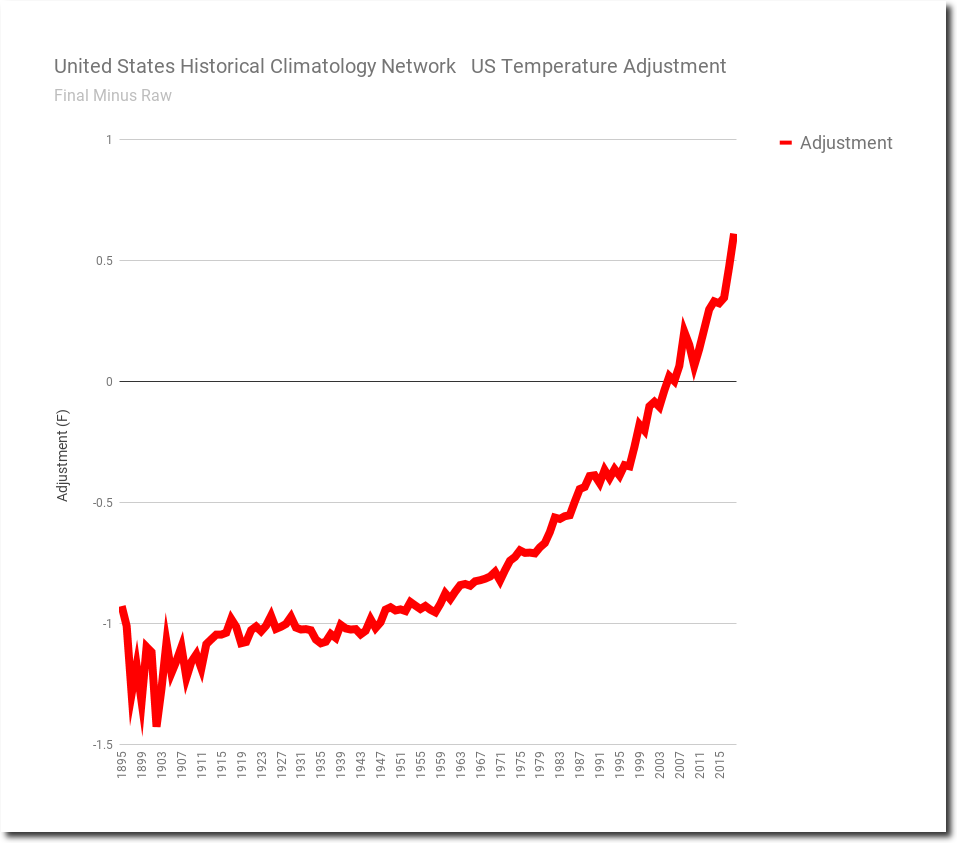
The total adjustment is now well over 1.5 degrees.

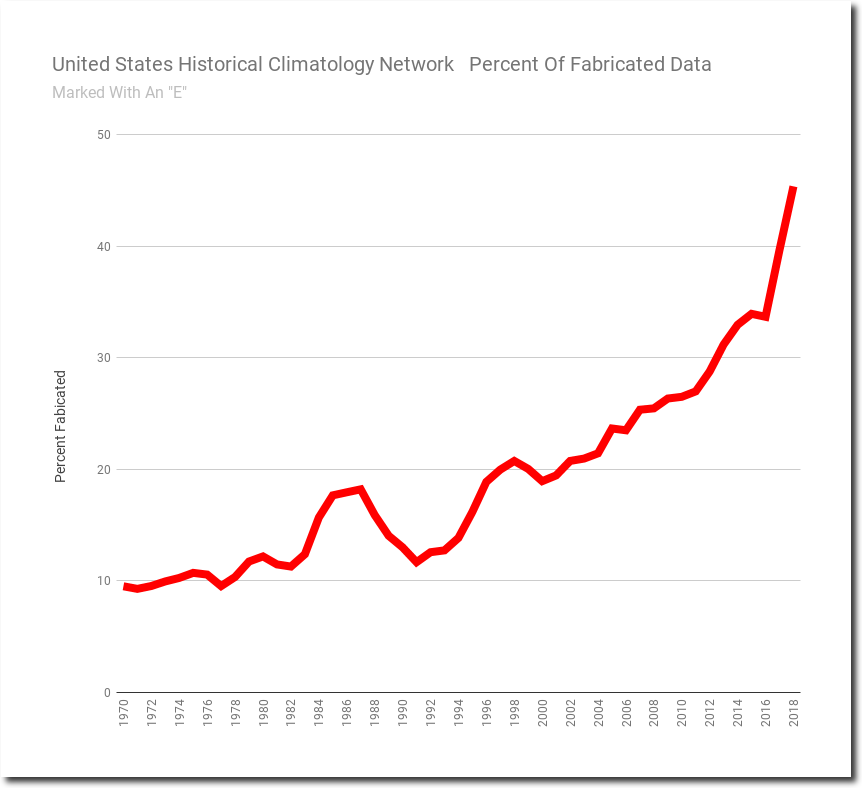
Almost half of their adjusted data is now fabricated,
allowing them to produce any shape graph they want.

October 14, 2018
Latest data from the United States Historical Climatology Network, showing how the US warming trend is created by altering the data in a spectacular hockey stick.
Spreadsheet Data
The total adjustment is now well over 1.5 degrees.
Almost half of their adjusted data is now fabricated,
allowing them to produce any shape graph they want.