

Plummeting June 17 Temperatures In The US
June 17, 2017
Prior to 1960, June 17 was typically a very hot day in the US.
But since 1960,
June 17 has been much cooler than the first half of the 20th century.
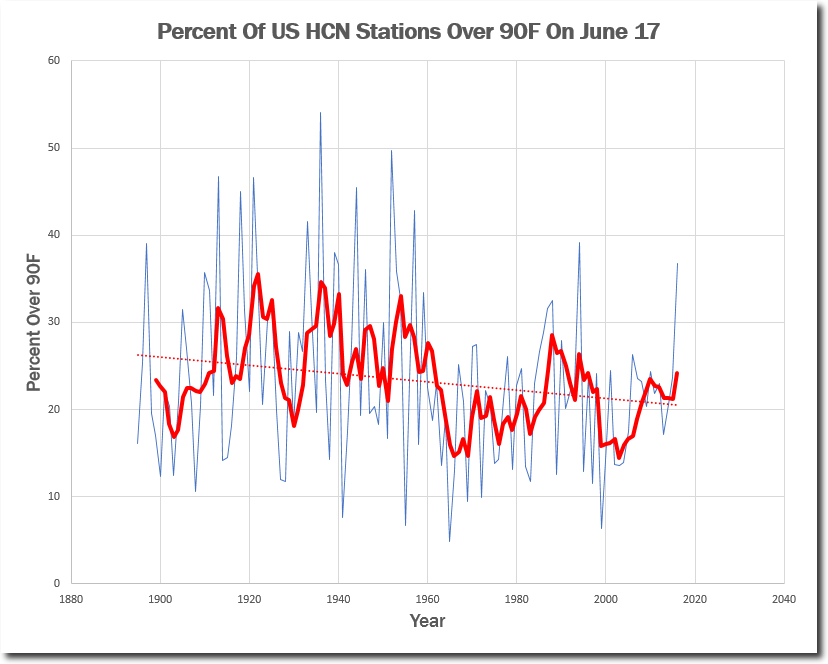
The ten hottest June 17th’s in the US were
1936, 1952, 1913, 1921, 1944, 1918, 1957, 1933, 1994 and 1897.
All but one were below 350 PPM CO2.
Prior to 1960, an average of 26% of stations were over 90F on June 17. Since 1960, that number has dropped to 20%.
The summer of 1936 was the hottest on record.
On June 17, 1936 there were
90 degree temperatures in almost every state, and
a huge swath of the country was over 100 degrees.
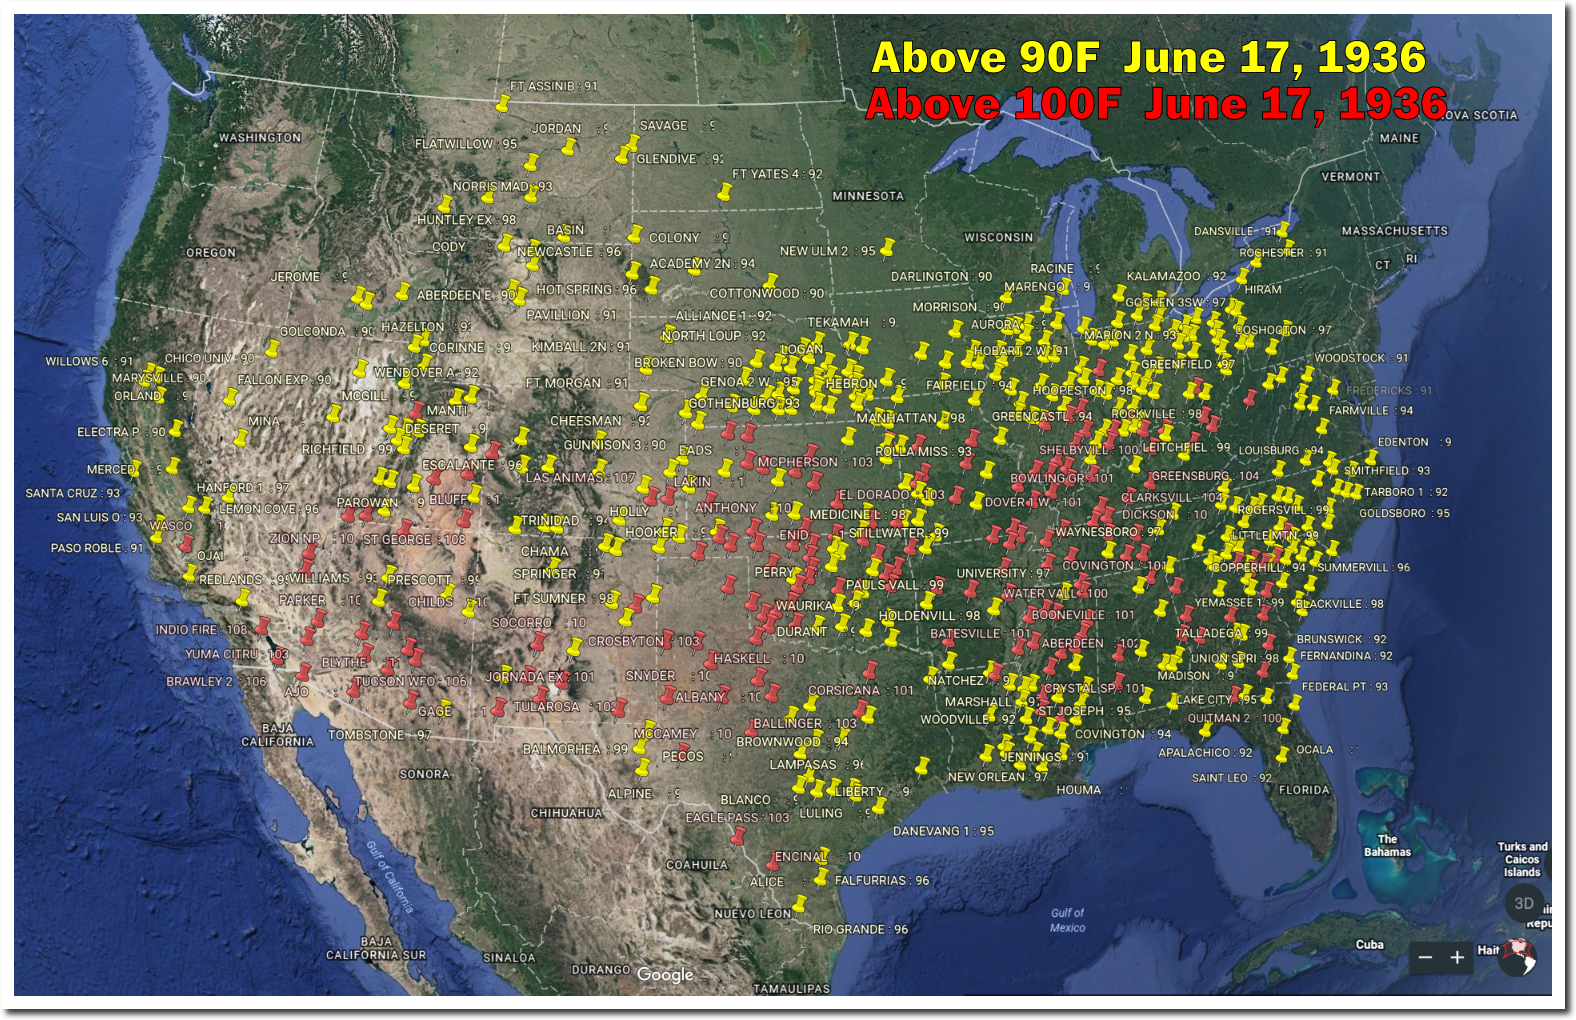
Google Earth
June 17, 1936 was the beginning of an incredible heatwave which lasted through the end of September. It was 105F at Seymour, Indiana that day.
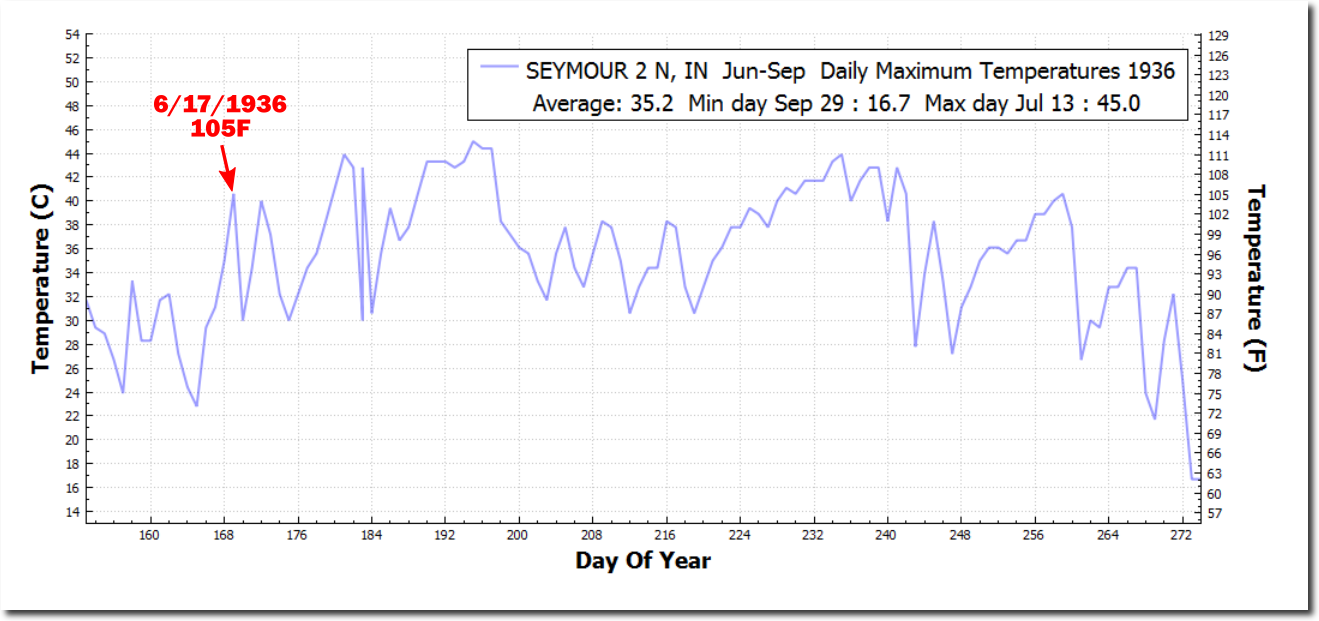
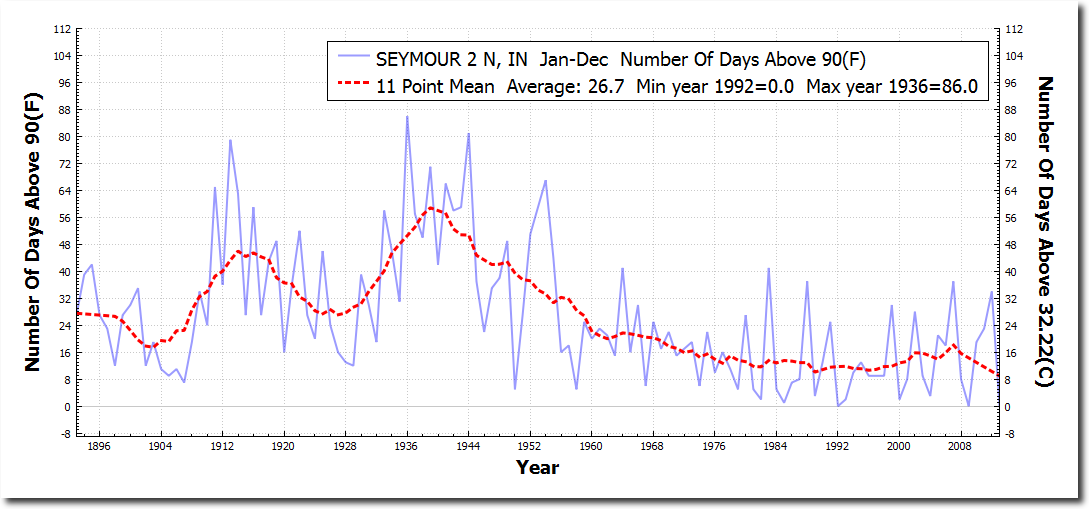
Seymour had eighty-six days over 90 degrees in 1936- but now they average fewer than fifteen 90 degree days per year.
The frequency of 90 degree days has plummeted over the last 80 years.
This week in 1988,
James Hansen appeared before Congress,
announced the “beginning of the greenhouse effect” and
said his computer model predicted
an increase in heatwaves
and drought in the Midwest.
He said he was 99% certain.
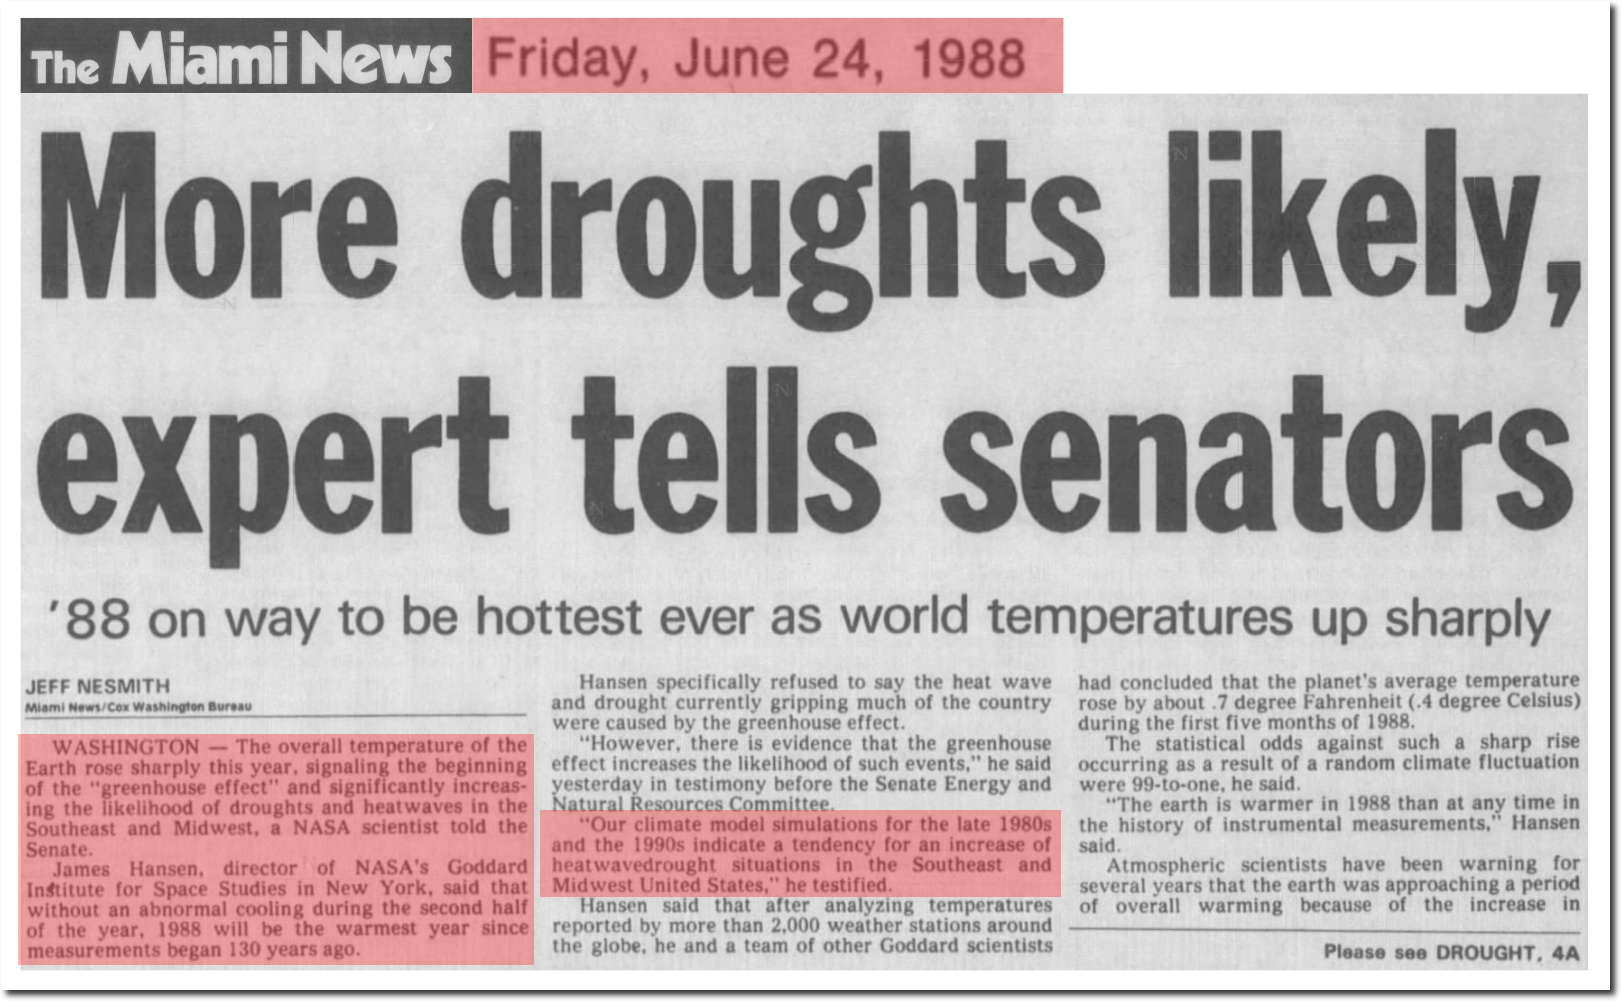
24 Jun 1988, 4 – The Miami News
Since Hansen made that forecast, both heatwaves and drought have nearly disappeared from the Midwest.
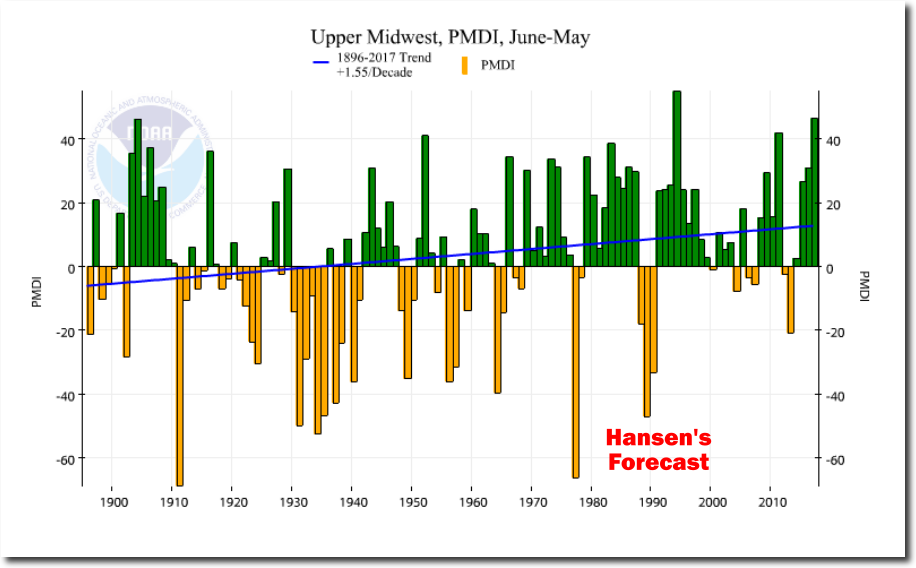
Climate at a Glance | National Centers for Environmental Information (NCEI)
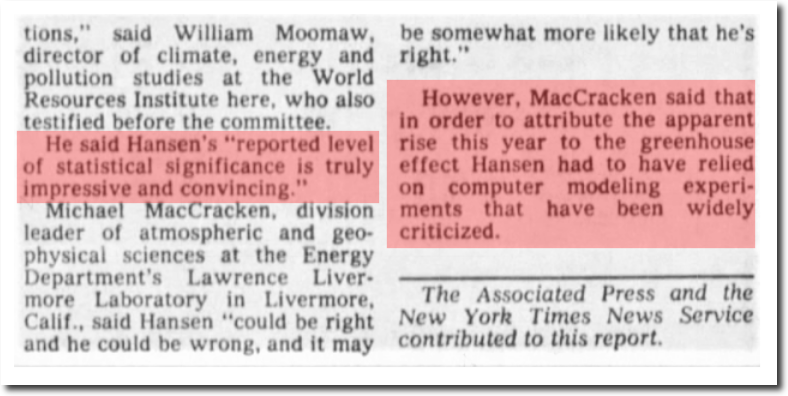
Some scientists were taken in by Hansen’s BS in 1988 – but
many recognized that
his computer models were not actual science.
James Hansen is the leader of the global warming movement, and
he has absolutely no clue what he is talking about.
The climate has done the exact opposite of what he predicted.
The global warming scam persists decade after decade, despite all evidence to the contrary.
Hansen’s temperature data was fake, and
Gavin Schmidt has made it even faker.

Wood for Trees: Interactive Graphs
