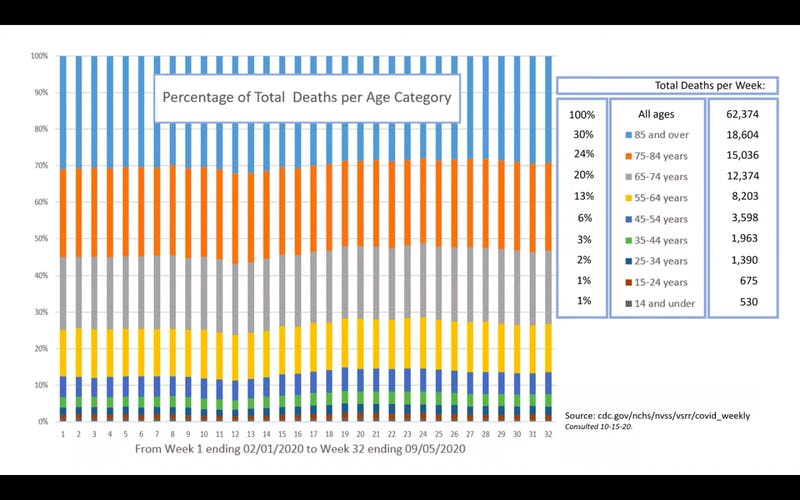
Apparently. It’s also worth remembering the vast majority of the covid deaths were people in their 70s (end of their life expectancy) or in nursing homes/long term car facilities/hospices. Nothing to see here.
Those numbers are misleading. Look at total all cause deaths in 2020 and compare those numbers to all cause deaths from 2019, 2018, and 2017. This will sift through the noise of all the allocation games that are being played with the covid death numbers. There is nowhere close to 230K extra deaths in 2020 unless you think an extra 230K people suddenly stopped dying from cancer, heart disease, etc. in 2020 and covid19 deaths filled in the gap.
TOTAL U.S. DEATHS [ALL CAUSES]:
2017 Total Deaths US: 2,813,503 (234,000/month)
https://www.cdc.gov/nchs/products/databriefs/db328.htm
2018 Total Deaths US: 2,839,205 (237,000/month)
https://www.cdc.gov/nchs/products/databriefs/db355.htm
2019 Total Deaths US: 2,855,000 (238,000/month)
https://www.cdc.gov/nchs/nvss/vsrr/provisional-tables.htm
2020 Total Deaths US (jan - week 9/26): 2,130,000 (236,000/month)

data.cdc.gov
2,130,000 + (236,000/month x 3) [Oct, Nov, Dec] = 2,838,000 [assumption based on monthly avg]
2020: 2,838,000 [3-month assumption insert]
2019: 2,855,000
2018: 2,839,000
2017: 2,814,000
Why did select [D] govs push C19 infected patients into nursing homes?
% of total C19 deaths attributed to nursing home(s)?
Who is most susceptible?
Same [D] govs who pushed C19 infected patients into nursing homes attempting to keep State(s) closed?
Why?
As an update to the 2020 numbers listed above at the end of Nov the cdc is showing all cause deaths at 2.58 million. We may even end up with less overall deaths in 2020 than previous years. Where are all the excess covid deaths??
National Center for Health Statistics

www.cdc.gov